
Tag: R
-

Creating a Publication Quality Phylogeny Using ggtree
A decade ago, circa 2012-2013, I used MEGA5 to infer phylogeny using simple Neighbour-Joining methods, and used the figure generated by MEGA5 to present and publish my results. Later, when I started learning other phylogeny reconstruction methods like Maximum Likelihood (ML) and Bayesian (which does not draw the tree for you), I started to explore…
-

Calculating Fst for haploid data in R
How to estimate the fixation index, FST, to test for population differentiation in R
-
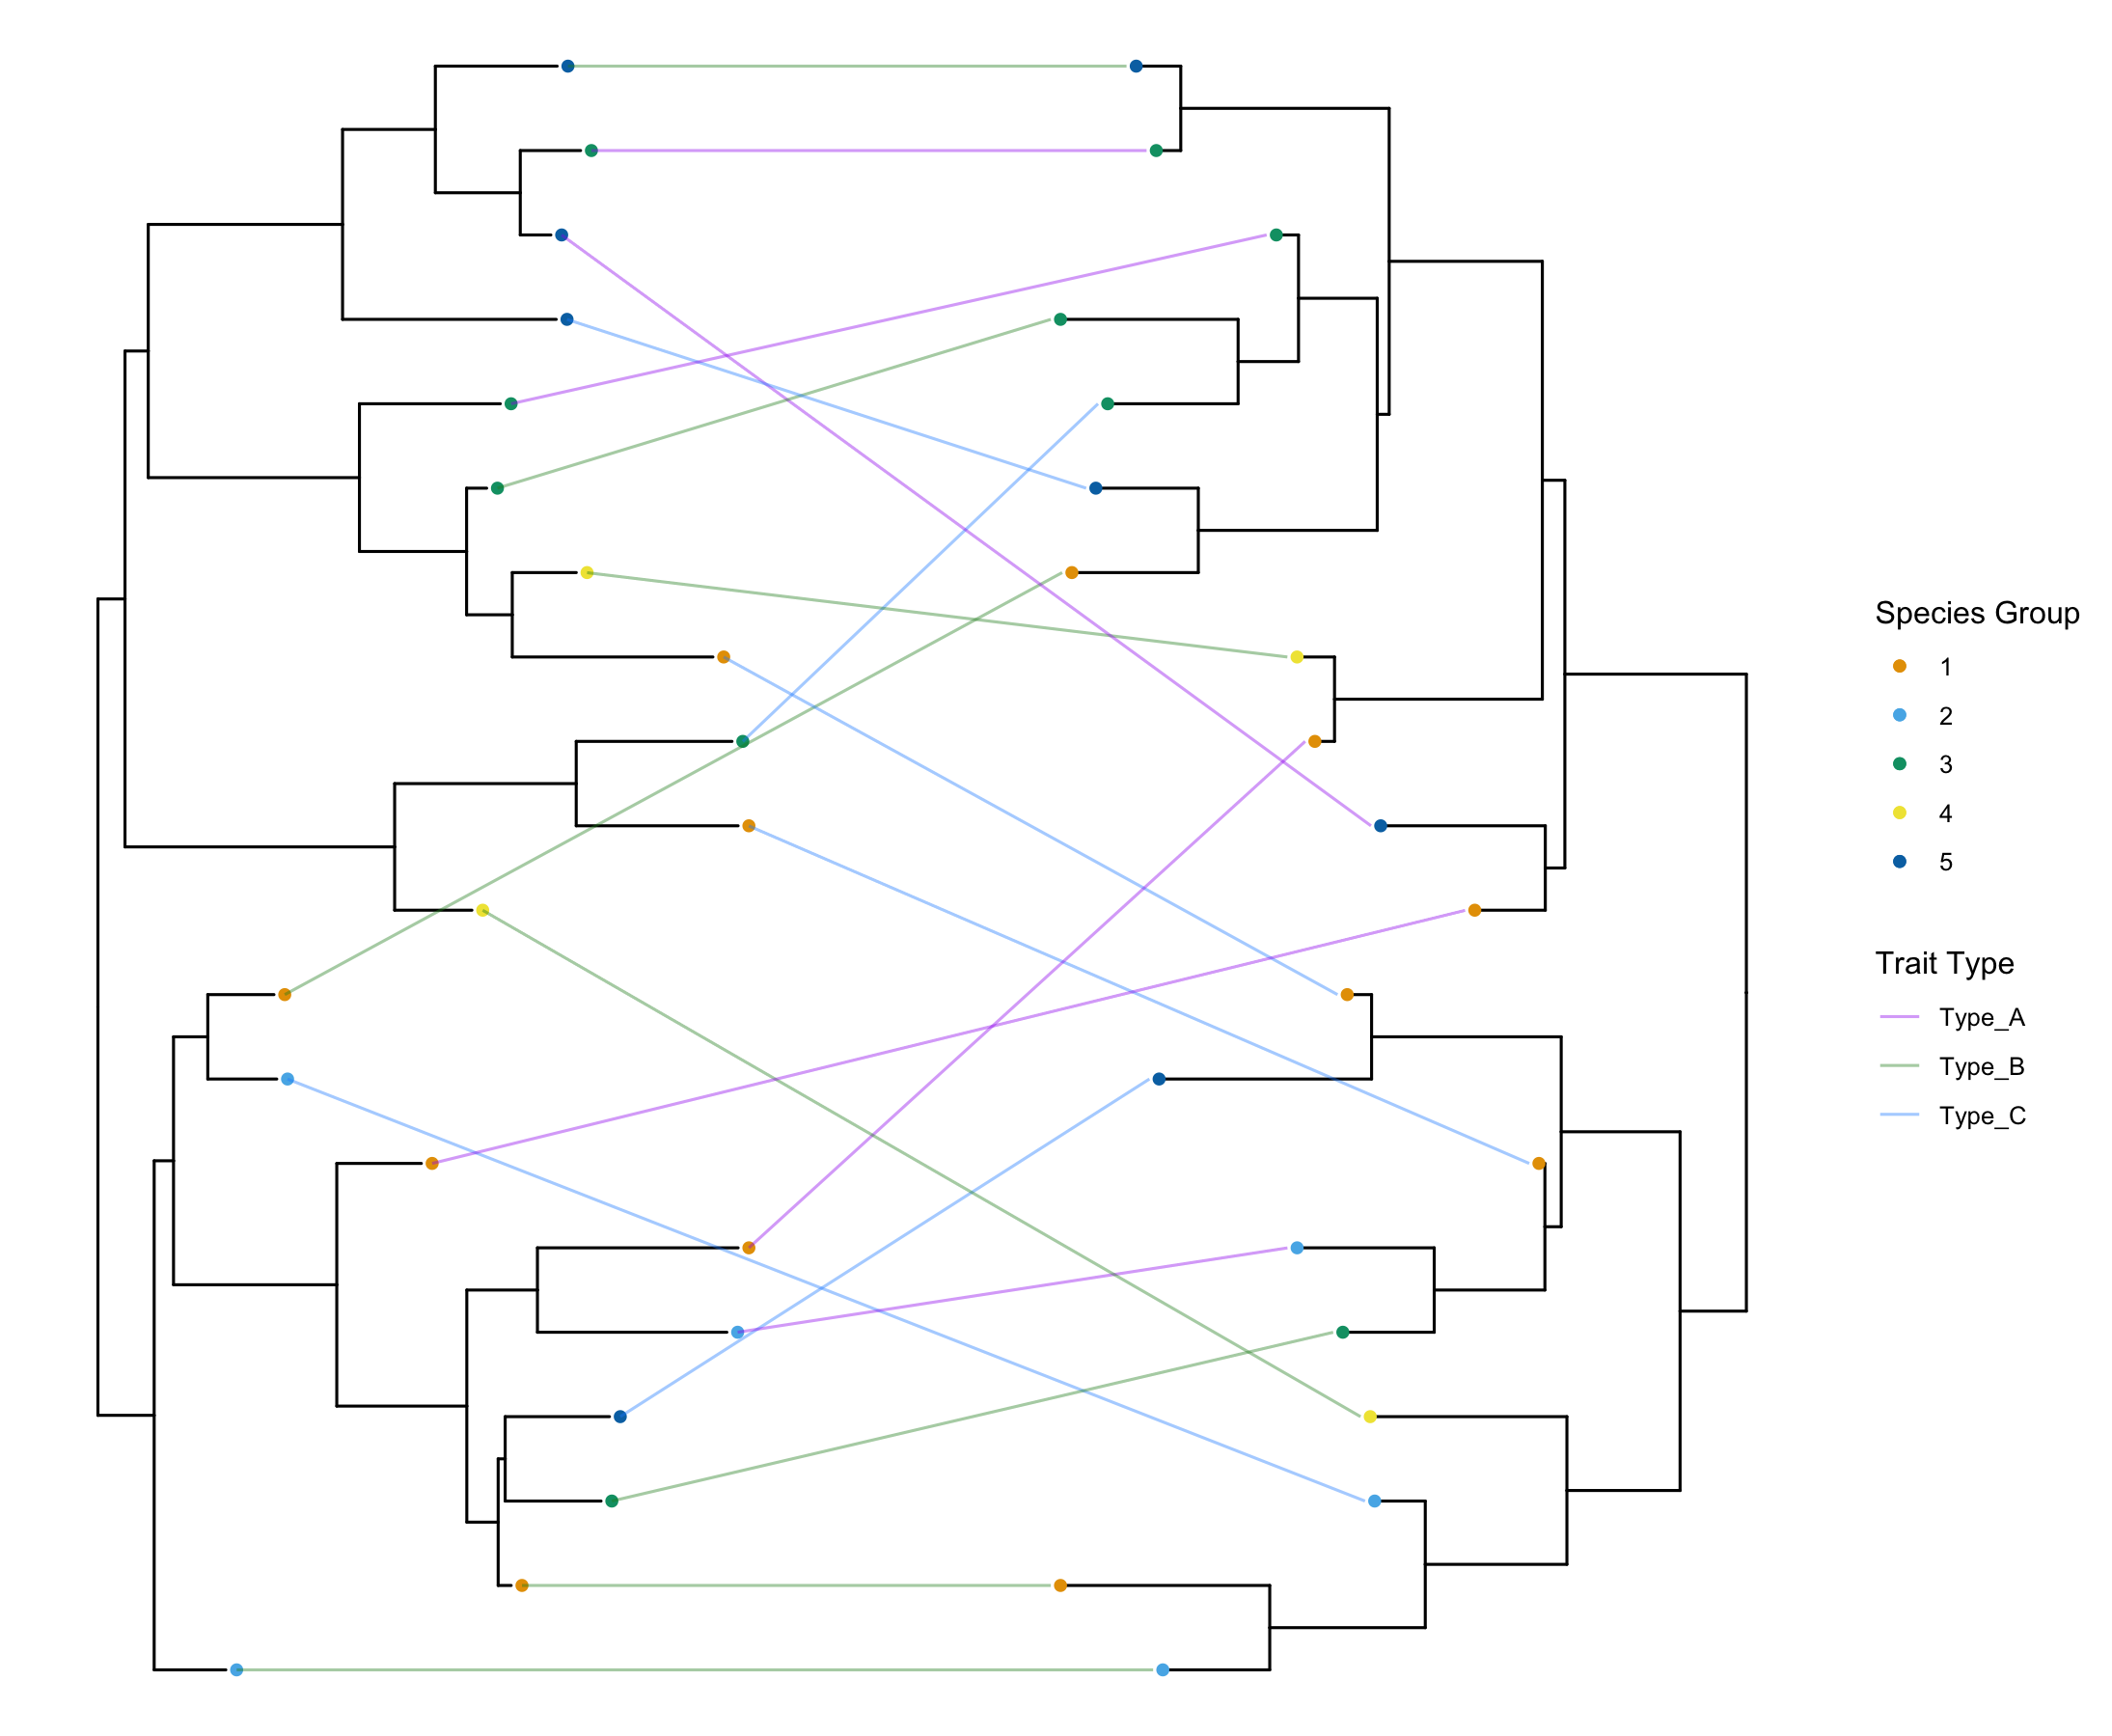
How to make Co-phylogeny plot: easy tanglegram in R (Updated Method)
Tanglegrams are co-phylogeny which is a very powerful visualization tool to examine co-evolution. Here is a tutorial on how to make them in R.